Roozan Zarifian, CIO of Los Angeles County’s HR Department, says Microsoft Azure Databricks provides her staff with a scalable data management solution.

Sep 30 2022
Data Analytics

State and Local Agencies Automate Data Analysis with Software as a Service

Cloud-based tools help scrub and organize data for easy viewing and sharing.

When it comes to hiring, Los Angeles County wants to improve its recruitment process, further diversify its workforce and reduce the time it takes to fill open positions — and it plans to do so with the help of a new cloud-based data analytics platform.

LA County’s Human Resources Department once manually built reports on its hiring data, a time-consuming and inefficient task. But it recently collaborated with the county’s Internal Services Department (ISD) to deploy Microsoft Azure tools, including the Azure Databricks analytics platform, to automate the effort.

County staff can now immediately access dashboards providing real-time insights, including demographics of job candidates and the time it takes candidates to go through each step of the hiring process, says Roozan Zarifian, CIO of LA County’s HR Department.

An increasing number of local and state governments are adopting cloud-based data management and analysis tools to centralize information from disparate data sources and power their data sharing and analytics initiatives. Cloud tools can automate many of the processes, including extracting and integrating the data, cleaning and curating it for use and building reports on dashboards, says Bradley Shimmin, Omdia’s chief analyst of AI and data analytics.

Click the banner below to receive customized content by becoming an Insider.

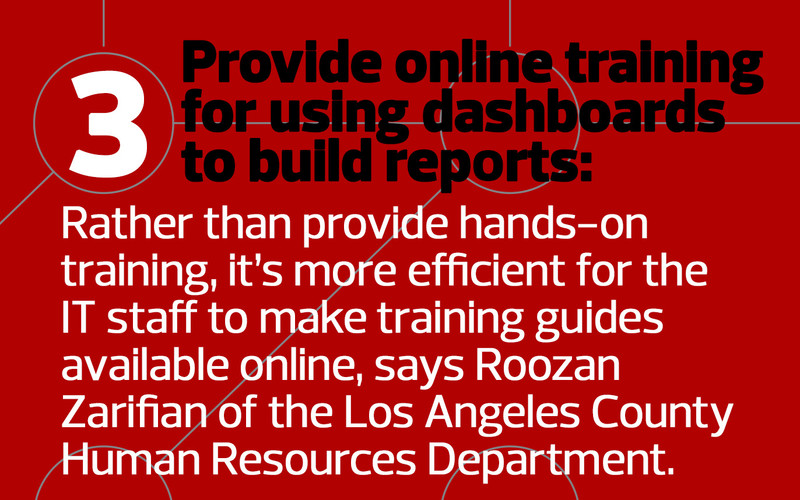
Years ago, on-premises data analytics solutions required IT staff to build reports for users. Now, through a cloud-based, self-service model, users can do it themselves, Shimmin says.

“Organizations want to understand the entirety of their operations,” he says. “To do so, people must be empowered to gain access to the data on their own terms in real time, without having to make a request to IT.”

DISCOVER: How Virginia's chief data officer elevates the role of data in government.

How Los Angeles Is Implementing Modern Data Architecture

Los Angeles County built a data analytics platform in Azure, using an integrated set of Microsoft and Databricks technologies.

Azure Data Factory automatically pulls siloed data from six on-premises applications and Google Analytics, and unifies the raw data into Azure Data Lake Storage, says Majida Adnan, acting deputy general manager of the county’s ISD.

Azure Databricks and Data Factory clean the data — deleting duplicate data and making sure data is formatted the same way — making it ready for analysis. Then the county uses Azure Synapse Analytics and Microsoft Power BI to perform the analytics and provide real-time reports, she says.

The entire data extraction, loading and transformation process is automated. The county also uses Active Directory and Azure Key Vault to authenticate users, make sure sensitive data is secured and certify data governance compliance, such as allowing only employees with access privileges to review reports, Adnan says.  

EXPLORE: How ports across the country are turning to IT networks for visibility into cargo data.

LA County chose to build a cloud solution because it’s scalable, flexible, easy to use and provides the performance it needs, Zarifian says. “We wanted a tool in place that would let our executives, board officers and the HR staff really slice and dice data, look at the hiring process, and every step of the way, identify the bottlenecks and make improvements,” she says.

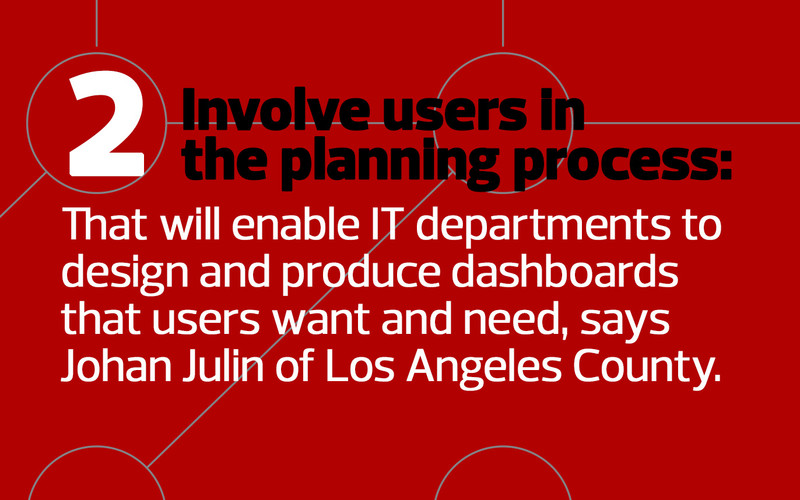
Previously, Johan Julin, HR’s senior manager of talent acquisition, spent weeks manually querying databases and downloading data, then using Excel and IBM SPSS software to produce quarterly reports on hiring metrics for the county Board of Supervisors.

Now, the board, executives and department leaders can run reports themselves on Power BI dashboards and get results in seconds.

“I’m grateful for the automation,” Julin says. “It was time-consuming to do it manually.”

Roozan Zarifian
We wanted a tool in place where our executives, board officers and the HR staff could really slice and dice data.”

Roozan Zarifian CIO, LA County Human Resources Department

A Review of Washington's Data Quality and Governance 

In Washington state, the city of Spokane has embarked on a data initiative to eliminate data silos between city departments and integrate data into a single repository on a Microsoft Azure Databricks data lake.

The goal is twofold: promote transparency by providing residents access to open data; and enable departments to review data in real time and share data for analysis so it can improve city operations, says Shiloh Deitz, community data coordinator at the Spokane Public Library.

“The biggest value is being able to get rid of silos and look at complicated issues in a holistic fashion,” says Shawna Ernst, Spokane Police’s law enforcement technology and operations manager.

To do it properly, the city streamlined data sharing policies and developed data governance rules to protect residents’ private or sensitive information. They are also making sure data is accurate and that data formats are consistent, Deitz says.   

Spokane, which launched the effort in June 2020, has focused initially on 12 sources of citizen-related data, including utility bills, city permits and law enforcement records, says Peggy Lund, Spokane’s supervisory information systems analyst.

LEARN ABOUT: How operations centers are improving public safety by combining data streams.

The Databricks data lake serves as the foundation of the city’s new cloud-based system. Through Power BI or ArcGIS mapping software, city departments can connect to Databricks to build reports, Ernst says.

Before the data is available for consumption, the city uses an AI-powered tool that sits atop Databricks to analyze data quality, eliminate duplicate data and allow city staff to set data governance rules, she says.

The city is still implementing the project, uploading data and determining what data to make available to the public through its open-data project, Deitz says.

Some departments are early adopters. Now, instead of manually building reports, city officials can view real-time reports on the homeless population, says Daniel Ramos III, supervisory business systems analyst at the city’s Community, Housing and Human Services Department.

“For leadership teams trying to solve social issues, being able to monitor data in real time is a huge breakthrough,” he says.

How Kentucky Is Leveraging Weather and Traffic Data Tools 

The Kentucky Transportation Cabinet (KYTC) has deployed Google Cloud’s BigQuery data warehouse to provide state officials with real-time data on weather and traffic conditions statewide so they can respond to weather-related incidents.

KYTC’s Division of Maintenance, which built the analytics platform, also uses it to monitor snow and ice removal; track the location of snowplows and measure how much salt is being used to clear snow; and track engine diagnostic information so it can proactively maintain vehicles before they fail, says Randi Feltner, transportation engineer specialist for the maintenance division.

The maintenance division originally built a data analytics platform on-premises in 2014, but in 2019, it migrated the system to Google Cloud to simplify management.

“We had a good system, but as it grew over time, our team did not grow with it,” says Chris Lambert, a maintenance division systems consultant who has two full-time developers on his team. “We were spending more time managing architecture.”

DIVE DEEPER: How municipalities are using smart city initiatives to keep citizens informed.

Now, Lambert can focus on data science and has produced numerous dashboards, such as the Storm Severity Index he built in collaboration with Feltner. The Google Cloud pulls information about wind, air and road temperatures, and traffic speed data from 24 data sources across the state’s roads.

First, KYTC stores raw data in cold-tier storage in the Google Cloud. Then it uses Google Dataflow to process the data. Through scripts, metadata is added to each data source, such as specific locations from which the data originated. Then the data is moved to BigQuery where it is integrated, he says.

Lambert built dashboards using Google Data Studio, the search engine Elasticsearch and ArcGIS, providing users with real-time weather, traffic and road conditions at any point on a map.

Today, when a disaster occurs, KYTC can share dashboard information with Kentucky Emergency Management and federal agencies so they can respond and determine the best staging areas for relief efforts, Feltner says.

“With severe events, it’s impactful because we can provide partner agencies with situational awareness,” she says.

100 million

The number of records produced every day on Kentucky Transportation Cabinet’s cloud-based data management and analytics system

Source: Kentucky Transportation Cabinet
Photography by G L Askew II
Close

Become an Insider

Unlock white papers, personalized recommendations and other premium content for an in-depth look at evolving IT