


Kentucky Turns to GIS to Tackle the Opioid Epidemic

One person every 40 hours: that’s how often a life was lost to an opioid overdose in Northern Kentucky in 2015. That year, in the area across from downtown Cincinnati, Ohio, that encompasses four counties and 400,000 people, almost five times as many lives were lost to overdoses as to car accidents.
In an effort to battle the wide-sweeping opioid epidemic, the Northern Kentucky Health Department turned to geographic information systems (GIS). The county’s Heroin Impact Response Team (HIRT) launched a story map in October 2016 that has proven to be instrumental in using data to bring resources to those impacted by the epidemic; it has also created a more informed public.
“The opioid epidemic has been a problem in Northern Kentucky for quite some time now. We looked at five years of data in this story map and it’s easy to see that it is a problem,” says Ned Kalapasev, the agency’s GIS manager. “The rise of the use of opioid drugs stretches beyond just the overdose numbers. It affects anything from rates of blood-borne disease in communities, hospitalizations, fire, EMS and police response through the scope of the problem. The heroin epidemic is a public health issue as well as a community issue and it impacts all aspects of people and government.”
Building a Community Story with Public Data
 As a way to report on all the different factors related to this epidemic that both government and community members could call on for information, Kalapasev’s team decided to create a story map, pulling in multiple sources of data from the last five years and overlaying the information on a map of the community.
To build the map, the county turned to GIS company Esri and Jeremiah Lindemann, a solutions engineer at the company, who has been working to create story maps focused on providing information and resources on drug overdoses; Lindemann’s connection to this project is personal: He lost his own brother to the opioid epidemic.
“I’ve been doing personal advocacy on the opioid epidemic and have found my voice via map. It’s been great to see a lot of what I do making its way into governments because I really think that a community-based approach is really what’s going to help tackle this problem,” Lindemann says.
Esri has worked with several other counties and states to build GIS tools around opioid use, but Lindemann notes that Kentucky has one of the most all-encompassing maps of impact and resources.
According to Lindemann, when building the map, the company aggregates public data corresponding to three areas: what is happening with the epidemic, what the impact has already been, and what the community can do to be preventive.
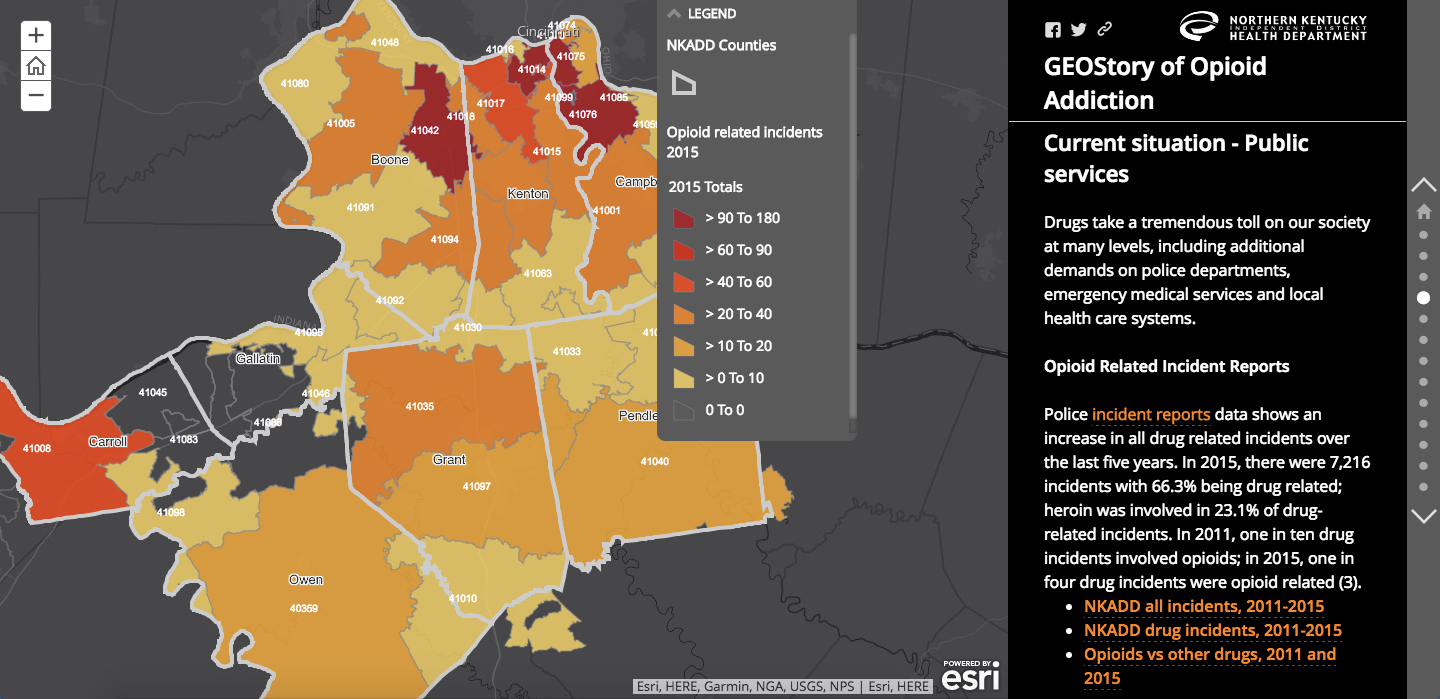
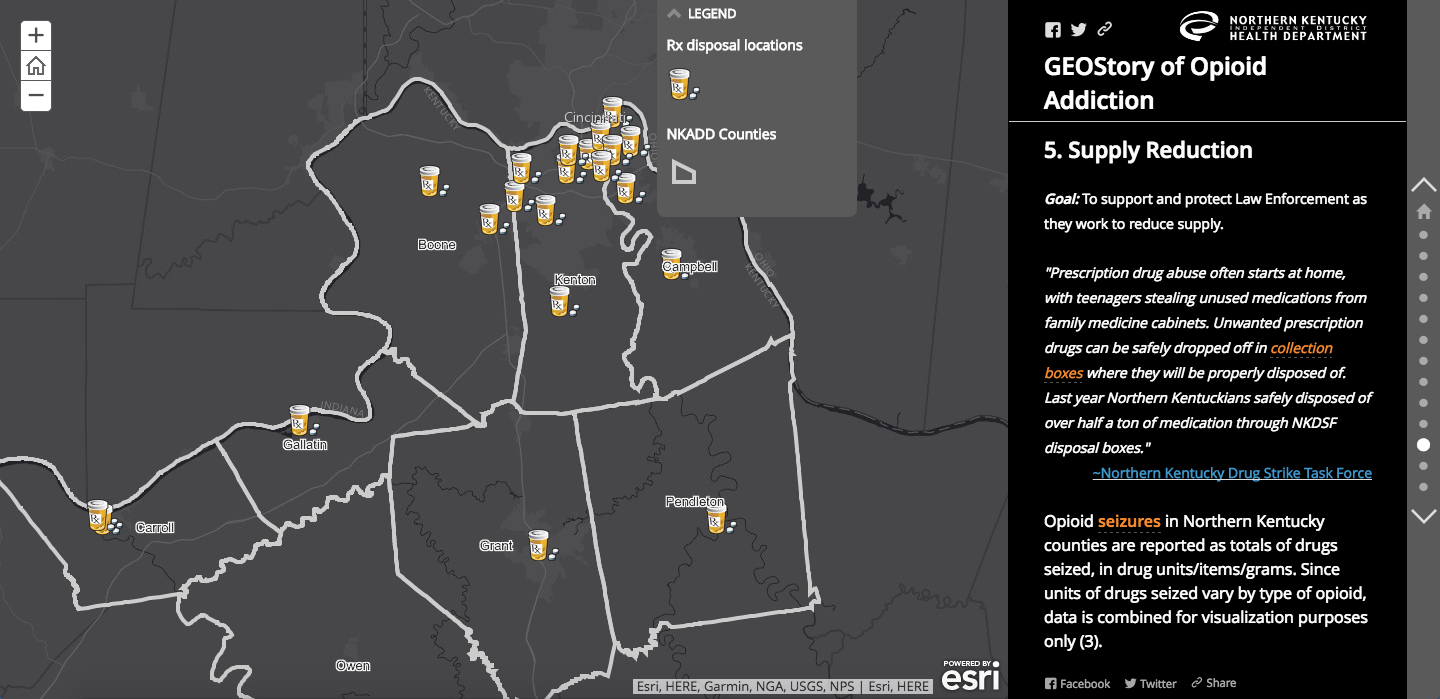
To gauge the impact, Esri incorporated county data on mortality and police incident reports, assembling maps and graphs that help tell the story around them. Looking at what’s happening now, they gathered public data on hospitalizations and overdose revivals using the drug Naloxone, which can reverse the effects of an overdose. Lastly, to push preventive measures, they assembled information on where to find Naloxone, prescription drop boxes and treatment facilities.
From concept to launch, the map took six months to build. With most of the software necessary to host the map already in place, substantial time was spent gathering the data and figuring out the best way to display it.
GIS Helps Kentucky Bring Resources to the Community
Since launching in October, the story map has generated over 10,000 views, averaging 75 views per day. The health department will update the data every six months to keep the resources and information relevant.
 For government, the map provides information on mortality (which shows the trends of overdoses within the community) as well as increased police and EMS responses related to opioids, pinpointing areas where the government may need to funnel more resources.
In Kentucky, the map aligns with plans for the region’s heroin response task force, which will be composed of city and county leaders as well as nonprofits. The task force will use the map tools to create a strategy around tackling the epidemic over the next few years, Kalapasev says.
For those impacted by the epidemic, the map provides resources on where to get help for addiction, prescription drug drop-offs so opioids don’t end up in the wrong hands, as well as information on where to access Naloxone.
But both Lindemann and Kalapasev believe the greatest impact on the map could be through creating community awareness about just how widespread this crippling epidemic has become.
“Citizens can look through the map and see how it is really impacting their neighborhood. How often police are responding to drug-related activities in their area. How are emergency medical services responding; what’s going on with overdoses and hospitalizations; how long people in your area have spent in a hospital for addiction, etc.,” says Kalapasev, noting that the opioid-related arrest rate skyrocketed between 2011 and 2015. “You can really see how it affects your area rather than just thinking that it’s not your problem.”
Lindemann is hoping that the story maps will allow for a better picture into the crisis, and inspire community outreach — the best tool for tackling the situation.
“There are a lot of people who are struggling and addicted and the question is: How are we going to get them resources like treatment and Naloxone availability? A lot of that is going to be done through the community: Setting up treatment centers, making sure there’s availability for Naloxone, ensuring that law enforcement is carrying Naloxone to revive, and then being preventive and creating awareness of what’s happening in the community,” says Lindemann.
In an epidemic that often feels swept under the rug, Lindemann is also hoping that greater community awareness will help neighborhoods understand the scope and seriousness of the impact, eventually driving change and resources.
“If you see a report on the nightly news about opioid addiction, it can be really easy to dismiss. But when a community starts talking about it, and you see the statistics on a map and exactly how many resources are being doled out around this, it starts to wake you up a little bit and makes you realize that this problem is right in your backyard,” Lindemann adds.