Data Analysis Opens Doors for New Outcomes at State and Local Agencies
Mark Greenwald, director of research and data integrity for the Florida Department of Juvenile Justice, compares disposition hearings for juvenile offenders to a multiple-path storybook: Different choices are certain to lead to vastly different outcomes, and judges must make momentous decisions with only the limited information available to them.
Greenwald’s job is to make that information as accurate, complete and relevant as possible.
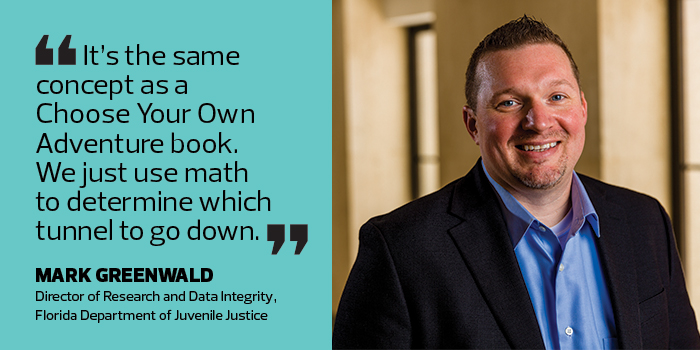
“It’s the same concept as a Choose Your Own Adventure book,” he says. “We just use math to determine which tunnel to go down.”
Like the FDJJ, many state and local agencies have made a deliberate effort in recent years to incorporate data into their decision-making processes. Part of that effort involves shoe-leather data collection through questionnaires and rigorous case reporting. But such initiatives also rely on robust analytics.
Justice Departments Jump-start City Analytics
The FDJJ uses Tableau analytics software, which helps Greenwald to easily crunch the numbers on factors such as the typical outcomes for certain treatments or custody recommendations for juvenile offenders — and then make the results accessible to judges, attorneys, case workers and other department personnel.
“Someone might have a feeling that youth with certain types of offenses might need to be in residential commitment,” Greenwald says. “But our research might say that lower-risk kids tend to do better in the community if they have appropriate services. We would go in and use our data to show, ‘Here are examples of similar kids, here are other pathways we took, and here are the outcomes we got.’”
Initially, Greenwald says, the department adopted Tableau to streamline reporting. Previously, the state’s delinquency profile report — which tracks arrests and intervention measures for various offenses, locations and population subgroups — was produced using Microsoft Excel.

Photography by Ryan Ketterman.
“It was a little bit clunky. It wasn’t very pretty, and it took a lot of time to produce,” Greenwald recalls. “We wanted something that was easier to use.”
Other agencies also have discovered great efficiencies with data analytics tools while improving the quality of service they provide to the public. For example, the Chandler (Ariz.) Police Department adopted the analytics tool Splunk to facilitate delivery of police-related services. With Splunk, the department has seen more effective allocation of resources and faster response times for police.
“Before, if you wanted to audit a user’s activity, you had to run queries in several locations and then compile them all together manually,” says Bill Edel, technology manager for the department. “With Splunk, we automatically dump all logs into the product and create queries and reports to display them as one.”
The Chandler Police Department also uses Tableau for public reporting. The police website at data .chandlerpd.com provides free and open access to the public for information such as arrest records, calls for service and use of force.
“This site provides an open data-sharing opportunity for the community to see already-produced visualizations of our data. They can download data to use themselves in their own tools or even an API where developers can have their programs automatically grab our data daily and include in their processes,” Edel says.
Shawn P. McCarthy, research director for IDC Government Insights, says that cities often start their analytics efforts in the police department.
“One quick data analytics project that many local governments tend to tackle is to see crime patterns overlaid on a map with additional information, such as time of day or type of crime,” he says. “This can help police departments target their policing efforts in a more cost-effective manner.”
Data Lets Departments Discover New Benefits
Cities are also using analytics tools for such things as tracking overtime to find more efficient staffing options and adjusting traffic lights to improve the flow of rush-hour traffic, McCarthy says. “I’ve even seen cities develop analytical modes that enhanced food inspection processes and sped up how the cities react to food service or health violations.”
The Chandler Police Department occasionally extends its use of Splunk to assist with criminal cases. For example, police can trace mentions of suspects matching a certain description by searching 911 call logs to uncover relevant information.
“We’re throwing all sorts of data into it,” Edel says. “We can do counts from calls for service, number of follow-ups, caseloads for detectives. But we can also dump in the actual text of things — all text for 911 calls. We can search back for certain time frames for anything that referred to a particular person or vehicle. I think the potential is there for more use in those areas.”
He adds, “It queries bulk data so fast. You could throw 5 million records at it, and it will index and query all of them in a matter of minutes.”
Data analytics help agencies uncover new ways of approaching challenges through a deeper understanding of their environment. At the Brooklyn Public Library, officials encourage workers to find creative new use cases for Tableau, which the organization has been using for several years. Workers have come up with ideas that help branch libraries better understand and serve their communities, says Diana Plunkett, manager of strategic initiatives for the library.

“One branch realized through demographic information that there were more teens in the neighborhood than they had realized, because they weren’t seeing them at the library,” Plunkett says. “They started to ask, how can we reach the segments of the community that aren’t coming into the branch? What can we do in terms of outreach? Having a better understanding of who’s in the community, even if they aren’t walking through the door, is a big part of it.”
Another branch looked at circulation statistics and reorganized shelf space to reflect borrowers’ preferences, and another used borrowing data to help inform a planned renovation.
“Without hard data, you rely on anecdotes,” Plunkett says. “Making information available is what we’ve done for a hundred years. This is just using tools to do it internally.”
Data Helps Tip the Scales for Local Agencies
Analytics will play a growing role in government in the coming years, Edel predicts. “I’ve been in this business for about 30 years, and it’s just ever-increasing,” he says. “The ability to analyze things and help us in policing is astronomical.”
The pace of adoption will depend in part, he says, on how attitudes toward things like the use of facial recognition technology evolves. “It’s very political, that Big Brother kind of thing. Probably, as people decide they want more security in certain areas, they will start driving that demand.”
FDJJ’s Greenwald says one of the biggest benefits of analytics is the ability to provide the public with ready access to information about the work that government agencies are doing. But, he says, the metrics also help to increase accountability and drive progress within the agencies themselves.
“I’m a big believer that what gets measured gets done,” Greenwald says. “When you’re collecting data on something, people tend to pay attention to it.” “Most of our metrics are moving in the right direction,” he adds. “If they aren’t, we start drilling into it and try to determine what’s going on.”


