Like other cities around the country, Minneapolis is striving to be more transparent with residents around issues of public health and safety, and the City of Lakes now has a tool to do just that.
In late October, the city launched Minneapolis DataSource, the first part of a larger strategy that city CIO Fadi Fadhil calls “digital quilting,” designed to knit together all of the city’s data sources.
DataSource has 41 different dashboards of continuously updated data and pulls data from various city services agencies, including those dealing with elections, housing, health, community safety, outdoor air quality, city workforce demographics and vacant and condemned properties.
“This is a cornerstone for us to create and have a digital, data culture — a data-driven decision-making culture — and this is going to be the cornerstone upon which we will continue to build and bring new capabilities and enhancements,” Fadhil said during an Oct. 22 City Council meeting.
Minneapolis said in a statement that the new tool will provide transparency and one place for residents and others to find city data. DataSource also offers “dynamic dashboards responding to user clicks and filters” and “intuitive navigation and visual data representation.” The city notes that the dashboards will “continue to grow as part of the continual service improvement efforts.”
The Benefits of Opening Up and Connecting Data
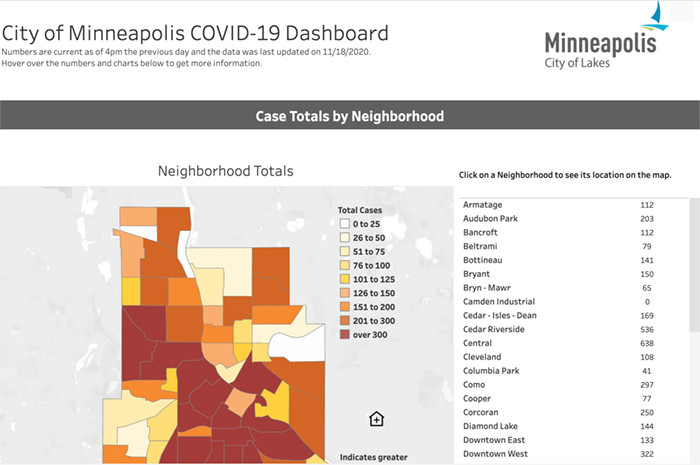
Currently, the featured dashboard is about COVID-19, and the city reports data about COVID-19 cases in Minneapolis on a daily basis. The community safety section includes dashboards on officer-involved shootings, crime, use of force, stops by police, police misconduct claims and cases, and more. The public health section includes dashboards on outdoor air quality, health inspections and community gardens.
When users click on a dashboard, DataSource offers guidelines on how to use each dashboard and contextual information on terminology and how often the data is updated, Fadhil said during the meeting.
“These dashboards are interactive and they are reading the data right from the data analytics hub and it’s reacting to your clicks,” he said. “So, as you are clicking around, every time you hover there’s more information and it reacts live to your clicks.”
The DataSource platform is going to be enhanced, Fadhil says. Users can search through the dashboards by location, date and demographic information.
Minneapolis DataSource contains numerous dashboards related to public health and other services. Source: City of Minneapolis
“It almost turns us all into data scientists,” Fadhil said. “We look around, we click, we have that critical thinking and we get the analytics of the data. And we can even look for trends and get that story that the data is telling us.”
DataSource is part of a larger philosophy Fadhil has about data. He tells StateScoop that he wants to show city council members and administrators “the art of the possible” within data analysis.
“Digital quilting is an intentional idea that all of our data systems are to connect with each other to make a fabric of information, stitched together by the thread of systems,” Fadhil tells StateScoop. “[Policymakers] always lean on IT and say, ‘What can technology do?’ And technology goes back and says, ‘What do you want?’ But in reality, technology is responsible for showing the city the art of the possible.”
The idea is that Minneapolis will connect all of its data sets, allowing each to be used to create a correlation with all of the others. “In order for us to reach this capability of being able to quickly respond and show data elements and intersections and trends, we have to constantly and consciously make technology decisions that have digital quilting at the heart of it,” Fadhil says.


